Starting with Relocation Map, we come to the new Maps Overlayed plugin. It is a strict superset of the Relocations Map plugin. Section Map Overlay Behavior provides a switch:
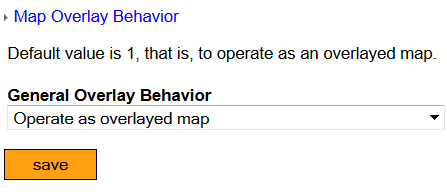
Switch for map overlay behavior
Operate as normal map
If this is chosen, the entire plugin behaves as if it only were the Relocations Map plugin. The data you enter in the Map Locations section will mostly work. None of the sections and fields connected with overlays will work, at all.
Operate as overlayed map
All fields and sections for overlayed data will be avaible and working. This is the default for this plugin.
The next section is
Overlay Coordinates
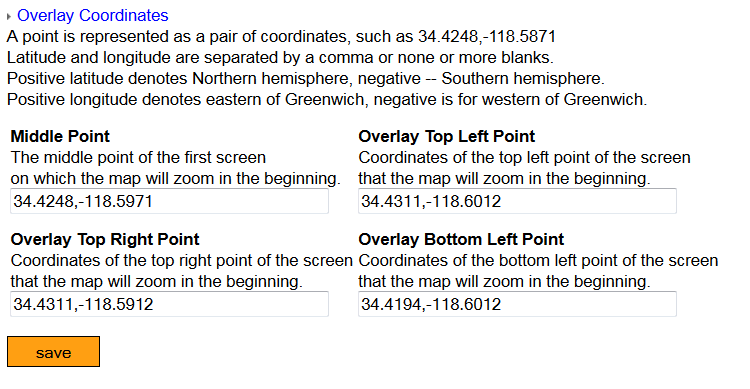
Overlay coordinates define the rectangle that will be overlayed with active elements.
The basic idea of the Maps Overlayed plugin is to define a rectangle on the map onto we want to concentrate the attention of the viewer. Not only that, we want to overlay — put a picture onto that rectangle — so that we both see elements of the picture and of the map beneath it. Furthermore, the overlay should zoom or relocate with the original map.
If we put a solid picture onto the basic rectangle, we will not achieve much. The goal is to put pins, images, circles… whatever have you as active elements that the user can further touch and see information beyond it. In case of standard pins, it is possible to touch the pin and a further callout shows, with the address of the pin and if we touch the calout, we can be transferred to the screen “beyond the mirror”. In that way, the entire map with pins can act as an elaborate menu, scattered across the screen.
A rectangle is defined as a set of four vertices. Each vertex is a point and here a point is an ordered pair of coordinates. The first number is called the latitude and has a value between 0 and 90 degrees. It usually is a decimal number. If positive, it denotes the Norther hemispere, if negative, it denotes the Souther hemisphere.
The second number is called the longitude and is a number between 9 and 180 degrees. If positive, it is denotes values Eastern of Greenwhich, if negative, it is to the West of Greenwhich.
For instance, 34.4248,-118.5971 is on Norther hemisphere, and to the “left” of the Greenwhich meridian. It is somewhere in North America, to be precise.
Instead of entering all the four vertices of the bounding overlay rectangle, it is customary to enter the middle point of the rectangle, and three vertices, namely. top left, top right and bottom left. The plugin will compute the remaining bottom right vertex, automatically.
If none of these coordinates is entered, the plugin will take the center of the map as a middle point, which will show itself as an empty place over the blue ocean on the map. You will have to pinch the screen many times to see some land, most likely in Africa.
There cannot be an overlay if there is no defining boundary so entering the data into this section is mandatory.
Overlay Image Section
The main purpose of this plugin is to overlay the image onto the map. However, you are not obliged to overlay it — maybe you do not have it yet, may be you have it are don’t find it sufficiently good for publishing yet, or simply, you have already overlayed other elements onto the map and you simply do not need the entire image yet. So, here is the switch:
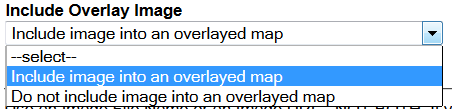
You may not always want to include the image into overlays
If you choose the first option, to include the image, you should also enter the data into the rest of the fields of this section. They are the usual fields for images, so we shall not describe them here.
Overlay Boundary Section
The beauty of the Maps Overlayed plugin is that you can overlay various lines and polygons, not only an image. From the technical standpoint of view, all these shapes will boil down to a series of points, and the software will fill in the space from one point to the next in the series. We get a line, more or less irregular, but useful in many ways. In this section we define one such series of points to be a boundary of the territory that we want to explore with map elements.
It looks stunning and is very useful if you don’t know much about the amusement park, or a zoo, or a children’s playground that you want to visit. Where a standard map might show green for the trees, you may insert the boundary of the estate and make it very clear whether to go further in that direction or not, for example.
First, you can include or not include the boundary into the overlay.
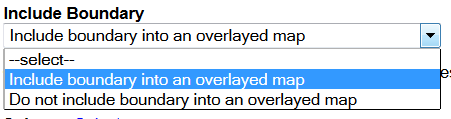
You do not have to include a boundary, even if you have it ready
Then you can select the color of the boundary:
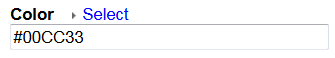
Change the color of the boundary at will
In the third field, Overlayed Boundary, we enter the series of points to represent the boudary polygon.
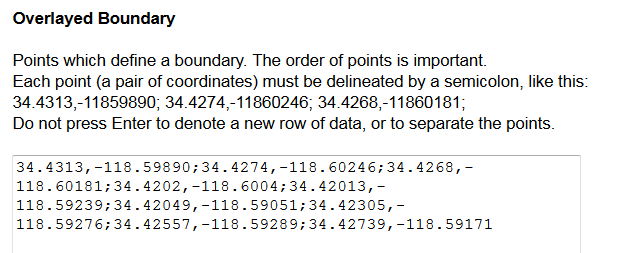
The textarea to define a series of points, which in turn definea boundary
The order of points is important. It is customary for a real boundary to be closed. In order to “close it”, you should put the last point to be identical to the first point in the series.
Each point (a pair of coordinates) must be delineated by a semicolon, like this:
34.4313,-11859890; 34.4274,-11860246; 34.4268,-11860181;
Ideally, the semicolon should be the last character in the series. If it’s missing, the plugin is smart enough to add it before further processing so you are allowed to not enter that last semicolon.
In normal entry fields, you could enter each point in one row, press Enter on the keyboard, enter a new pair of coordinates, press Enter and so on. Unfortunately, the underlying software treats this entry field as a piece of JSON text. See the warning in the following image:
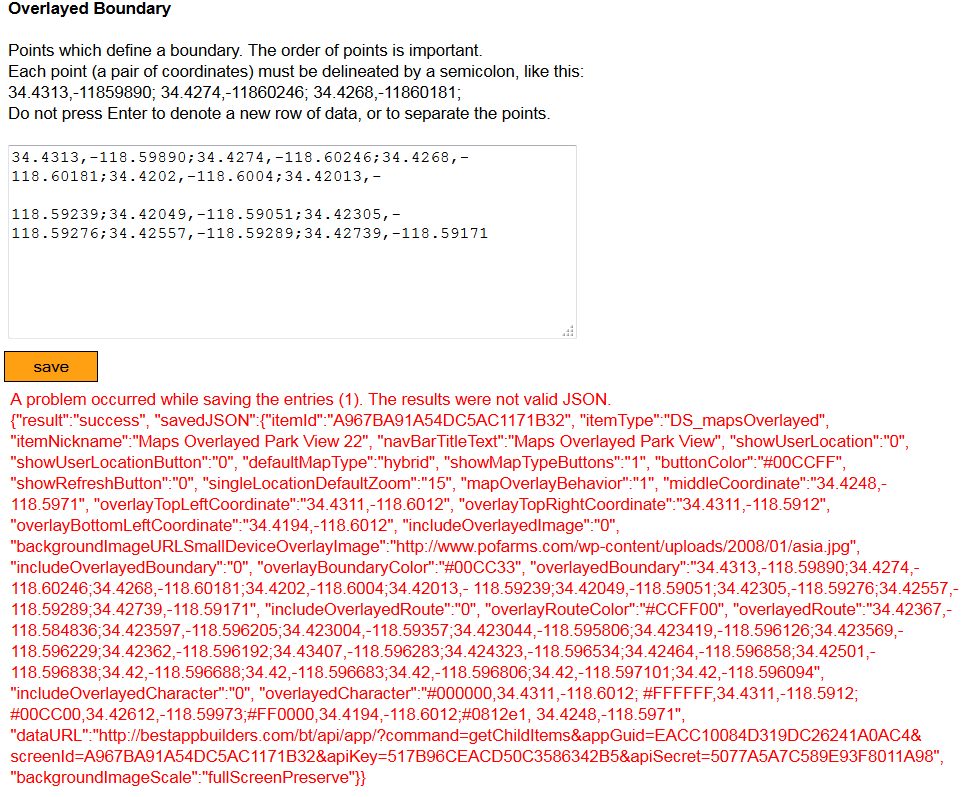
A JSON warning only because I pressed Enter after the second row
So, do not press Enter to denote a new row of data, or to separate the points!
The best way to prepare a series of points to serve as a boundary is to use an editor which can show invisible characters. Here is what the text input would look like in program Notepad++ fow Windows, after turning on the option View, Show Symbol, Show All Characters.
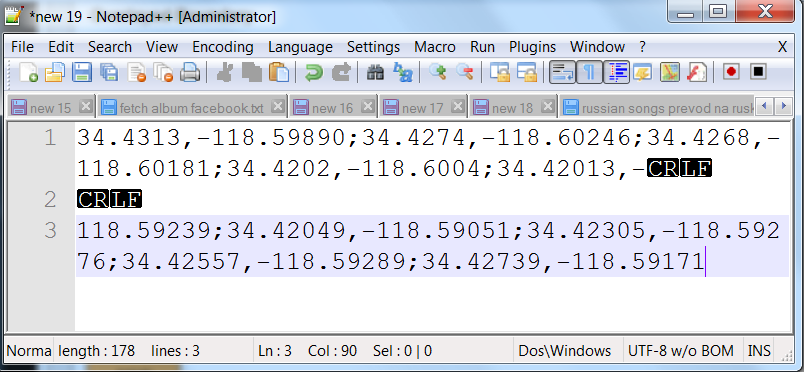
In Notepad++ you can clearly see where the problem end of line character lies.
Deleting these non-printing characters gives us the final string to copy to the the entry field for the boundary:
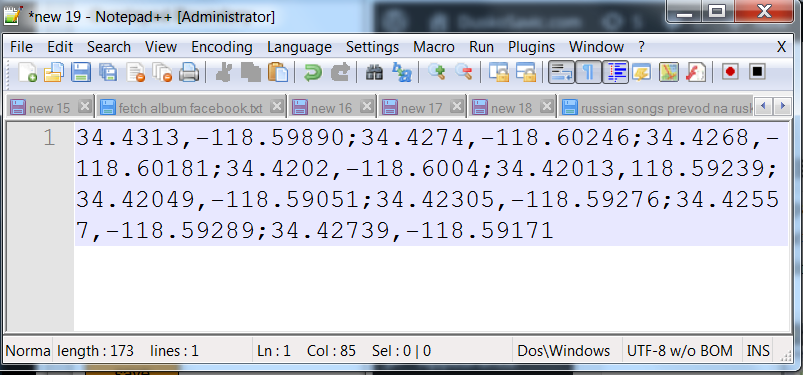
Cleare the strange characters and get string to enter into the boundary field
Once you click on the save button, and the green message Saved! appears, the system will have entered the boundary points. You may also want to go to the very last part of the control panel screen and click on the save button for the section JSON Configuration Data (Editable).
Let me repeat that it is of overall importance to see a green message Saved!. If the message is not green but red, the data will not be saved. This is a known bug in the control panel software. In that case, go to the first section at the top of the document, Screen Nickname, and change the nickname a bit. For example, add a digit or two and don’t worry, that will be the only place to make such a change.
Overlay Route Section

Section for routes is identical to the section for boundaries
This is totally the same as the overlay boundary except that instead of a boundary, you take coordinates of any path in between two points in the map. The idea is to show a kind of “driving directions” between two attractions in, say, a zoo. There could be more such routes of interest so a possible expansion for this app would be to take into account several routes instead of just one.
Overlay Characters — Colored Circles Section
This section will show colored circles on coordinates you decide upon. You enter a color in classical #FFFFFF format, followed by a point. So, it is color, latitude, longitude, followed by a semicolon, and so forth, for as many points that you want.
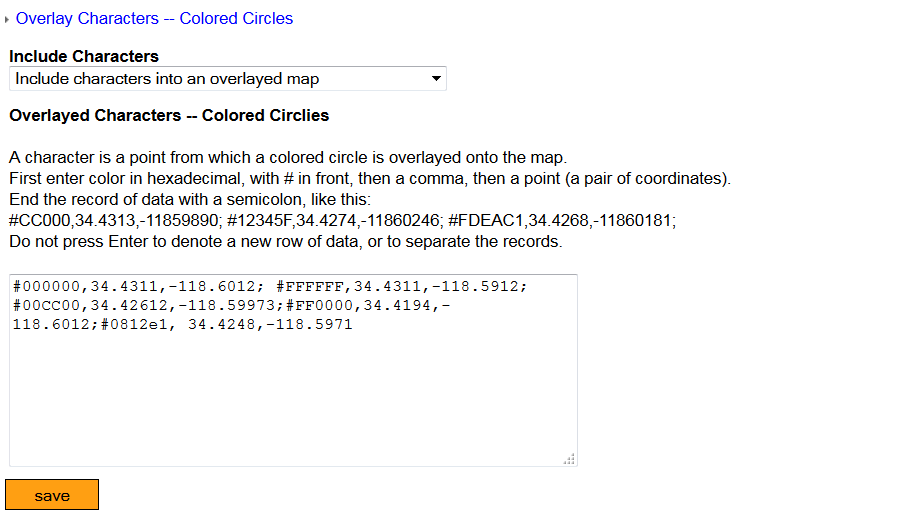
Points to draw colored circles